Current index 74,666.65 Change -908.60 Percent Change (-1.20%)

Daily movements of stock market indicators ie. KSE-100 index, quantity (number of trades), volumes (number of shares traded) and value (total traded amount in rupees). Similarly it shows number of companies traded and out of which how many were closed positive change, how many with negative change and how many without change.
Some posts are related to Top-10 Active Stocks i.e. companies with highest volumes (no. of shares). It also list Top-10 Advancers. These are scrips that gained higher percentage in change compared to previous day closing.
Current index 74,666.65 Change -908.60 Percent Change (-1.20%)
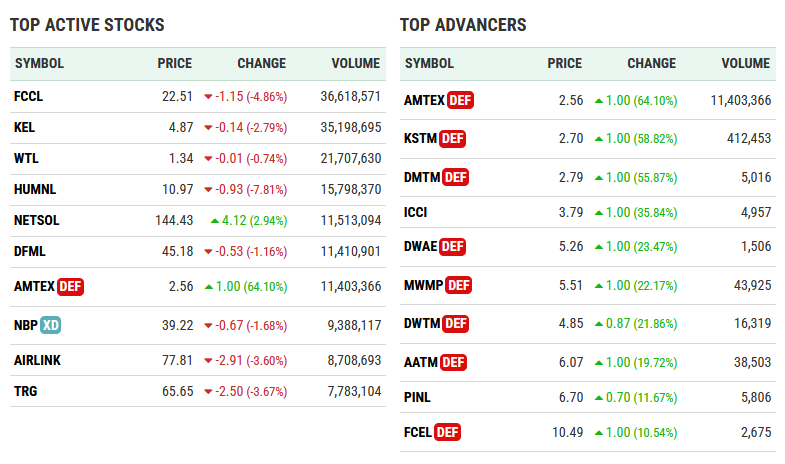
TOP ACTIVE STOCKS SYMBOL PRICE CHANGE VOLUME FCCL 22.51 -1.15 (-4.86%) 36,618,571 KEL 4.87 -0.14 (-2.79%) 35,198,695 WTL 1.34 -0.01 (-0.74%) 21,707,630 HUMNL 10.97 -0.93 (-7.81%) 15,798,370 NETSOL 144.43 4.12 (2.94%) 11,513,094 DFML 45.18 -0.53 (-1.16%) 11,410,901 AMTEXDEF 2.56 1.00 (64.10%) 11,403,366 NBPXD 39.22 -0.67 (-1.68%) 9,388,117 AIRLINK 77.81 -2.91 (-3.60%) 8,708,693 TRG 65.65 -2.50 […]
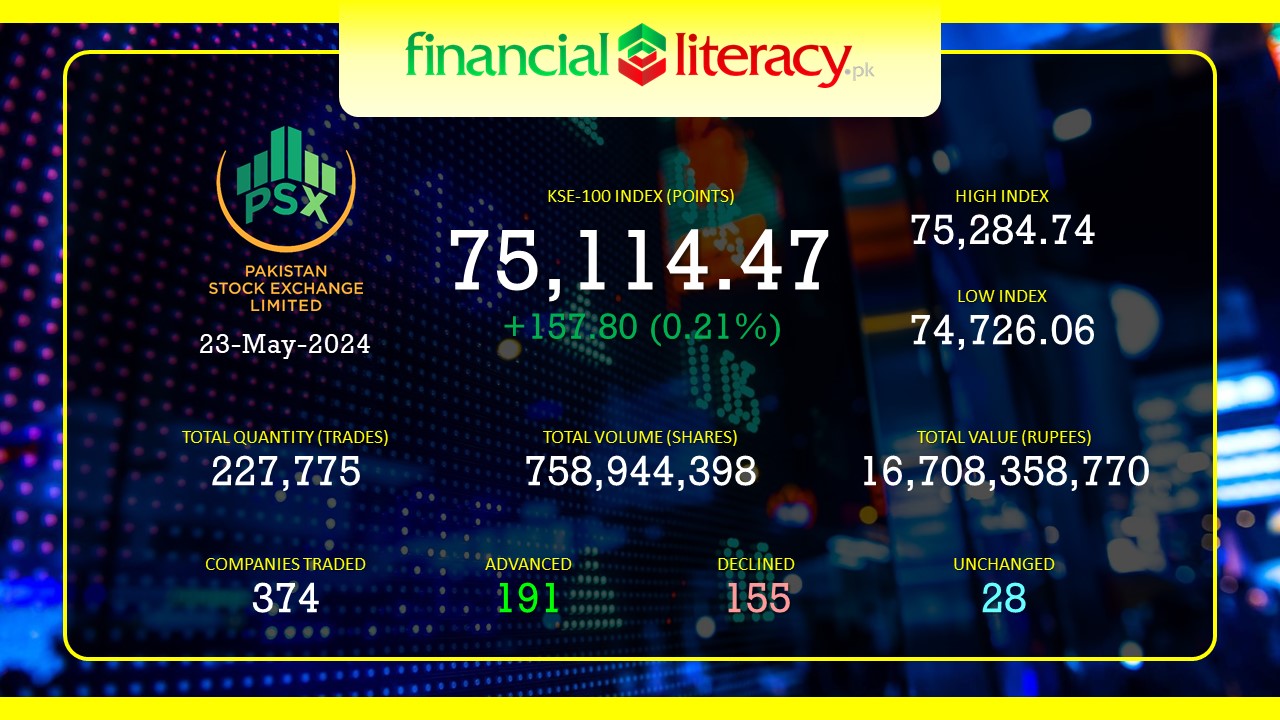
Current index 75,114.47 Change +157.80 Percent Change 0.21%
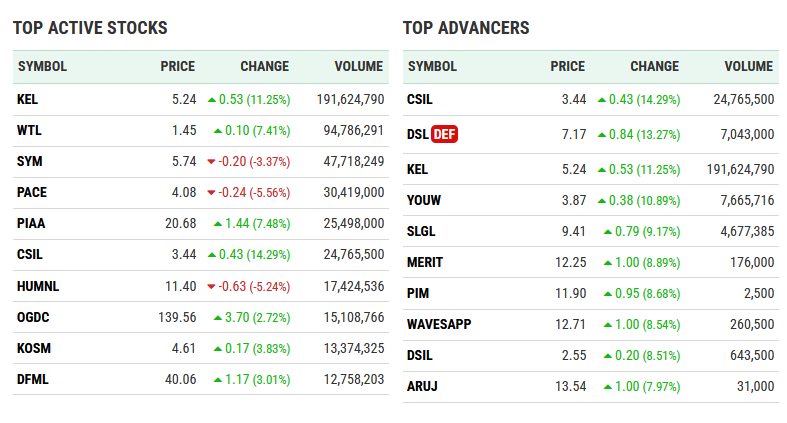
TOP ACTIVE STOCKS SYMBOL PRICE CHANGE VOLUME KEL 5.24 0.53 (11.25%) 191,624,790 WTL 1.45 0.10 (7.41%) 94,786,291 SYM 5.74 -0.20 (-3.37%) 47,718,249 PACE 4.08 -0.24 (-5.56%) 30,419,000 PIAA 20.68 1.44 (7.48%) 25,498,000 CSIL 3.44 0.43 (14.29%) 24,765,500 HUMNL 11.40 -0.63 (-5.24%) 17,424,536 OGDC 139.56 3.70 (2.72%) 15,108,766 KOSM 4.61 0.17 (3.83%) 13,374,325 DFML 40.06 1.17 […]

Current index 74,956.67 Change -250.10 Percent Change -0.33%
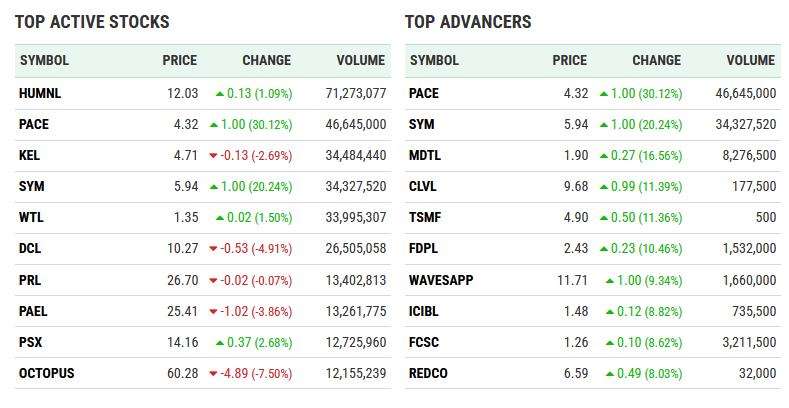
TOP ACTIVE STOCKS SYMBOL PRICE CHANGE VOLUME HUMNL 12.03 0.13 (1.09%) 71,273,077 PACE 4.32 1.00 (30.12%) 46,645,000 KEL 4.71 -0.13 (-2.69%) 34,484,440 SYM 5.94 1.00 (20.24%) 34,327,520 WTL 1.35 0.02 (1.50%) 33,995,307 DCL 10.27 -0.53 (-4.91%) 26,505,058 PRL 26.70 -0.02 (-0.07%) 13,402,813 PAEL 25.41 -1.02 (-3.86%) 13,261,775 PSX 14.16 0.37 (2.68%) 12,725,960 OCTOPUS 60.28 -4.89 […]
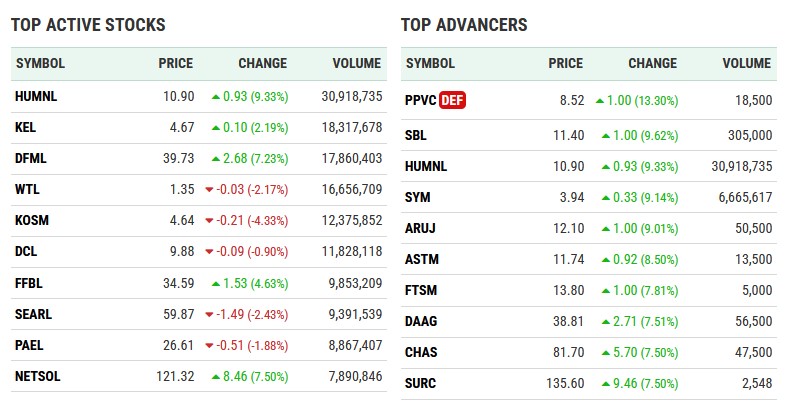
TOP ACTIVE STOCKS SYMBOL PRICE CHANGE VOLUME HUMNL 10.90 0.93 (9.33%) 30,918,735 KEL 4.67 0.10 (2.19%) 18,317,678 DFML 39.73 2.68 (7.23%) 17,860,403 WTL 1.35 -0.03 (-2.17%) 16,656,709 KOSM 4.64 -0.21 (-4.33%) 12,375,852 DCL 9.88 -0.09 (-0.90%) 11,828,118 FFBL 34.59 1.53 (4.63%) 9,853,209 SEARL 59.87 -1.49 (-2.43%) 9,391,539 PAEL 26.61 -0.51 (-1.88%) 8,867,407 NETSOL 121.32 8.46 […]

Current index 75,084.00 Change -258.34 Percent Change 0.34%
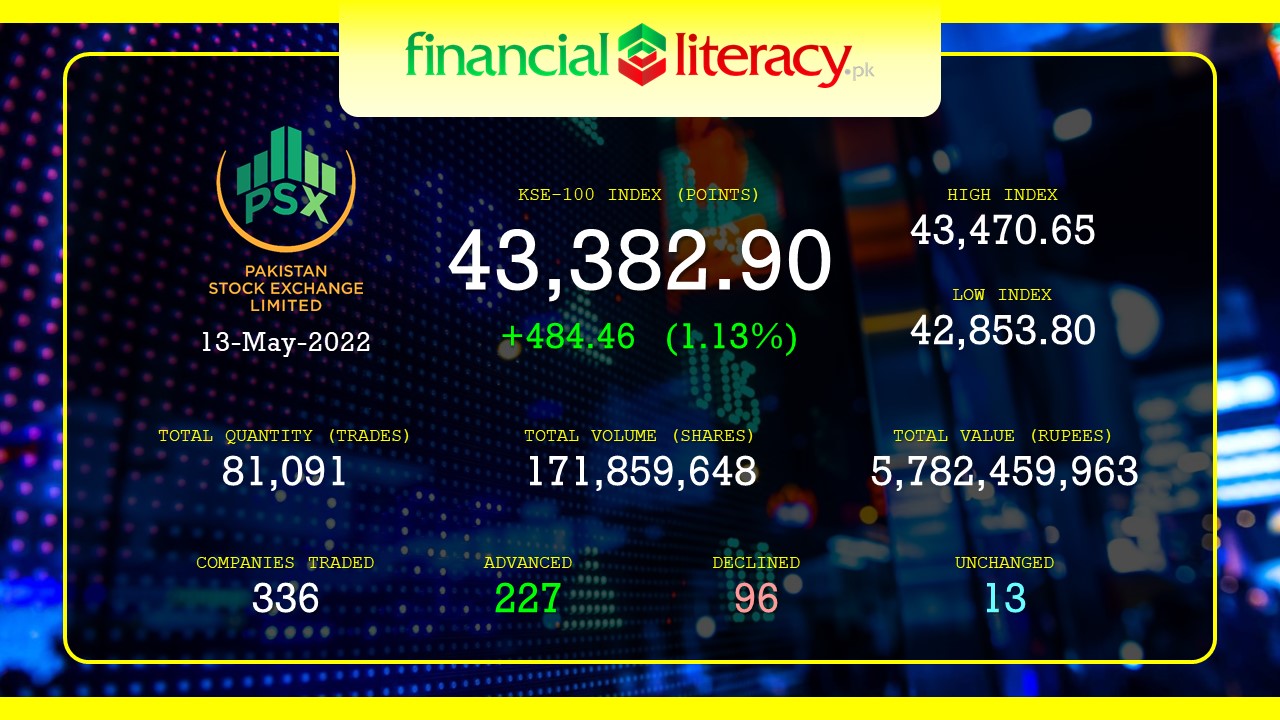
Current index 43,382.90 Change 484.46 Percent Change (1.13%)
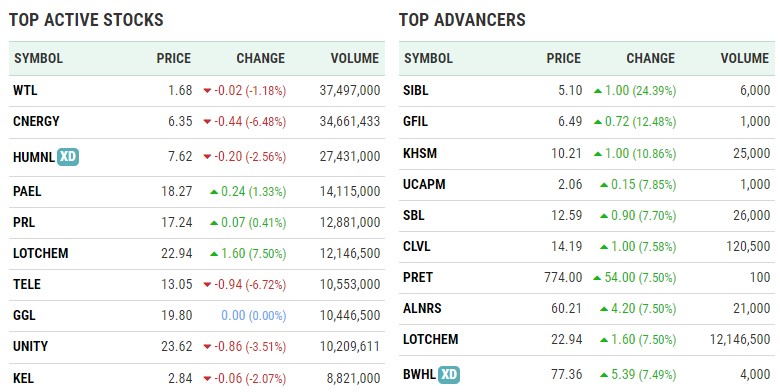
Top Active Stock SYMBOL PRICE CHANGE VOLUME WTL 1.68 -0.02 (-1.18%) 37,497,000 CNERGY 6.35 -0.44 (-6.48%) 34,661,433 HUMNL 7.62 -0.20 (-2.56%) 27,431,000 PAEL 18.27 0.24 (1.33%) 14,115,000 PRL 17.24 0.07 (0.41%) 12,881,000 LOTCHEM 22.94 1.60 (7.50%) 12,146,500 TELE 13.05 -0.94 (-6.72%) 10,553,000 GGL 19.80 0.00 (0.00%) 10,446,500 UNITY 23.62 -0.86 (-3.51%) 10,209,611 KEL 2.84 -0.06 (-2.07%) 8,821,000 TOP Advancers SYMBOL PRICE CHANGE VOLUME SIBL 5.10 […]