Current index 45,943.16 Change -390.20 Percent Change (-0.84%)

Daily movements of stock market indicators ie. KSE-100 index, quantity (number of trades), volumes (number of shares traded) and value (total traded amount in rupees). Similarly it shows number of companies traded and out of which how many were closed positive change, how many with negative change and how many without change.
Some posts are related to Top-10 Active Stocks i.e. companies with highest volumes (no. of shares). It also list Top-10 Advancers. These are scrips that gained higher percentage in change compared to previous day closing.
Current index 45,943.16 Change -390.20 Percent Change (-0.84%)
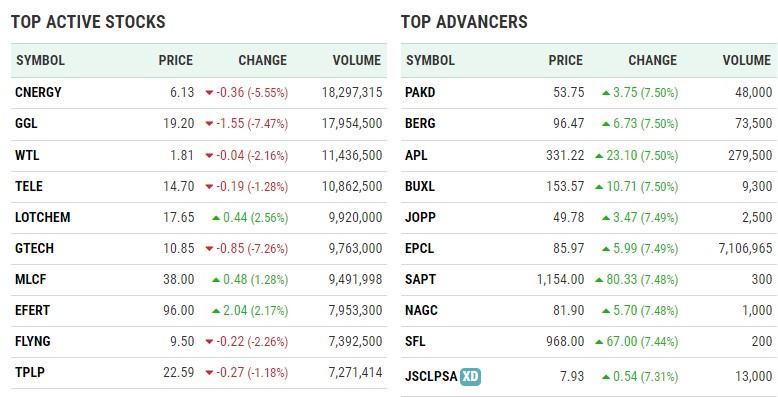
Top Active Stock SYMBOL PRICE CHANGE VOLUME CNERGY 6.14 -0.35 (-5.39%) 18,297,315 GGL 19.36 -1.39 (-6.70%) 17,954,500 WTL 1.80 -0.05 (-2.70%) 11,436,500 TELE 14.80 -0.09 (-0.60%) 10,862,500 LOTCHEM 17.60 0.39 (2.27%) 9,920,000 GTECH 10.76 -0.94 (-8.03%) 9,763,000 MLCF 37.96 0.44 (1.17%) 9,491,998 EFERT 96.26 2.30 (2.45%) 7,953,300 FLYNG 9.51 -0.21 (-2.16%) 7,392,500 TPLP 22.73 -0.13 (-0.57%) 7,271,414 TOP Advancers SYMBOL PRICE CHANGE VOLUME PAKD 53.75 […]

Current index 46,348.93 Change -190.66 Percent Change (-0.41%)
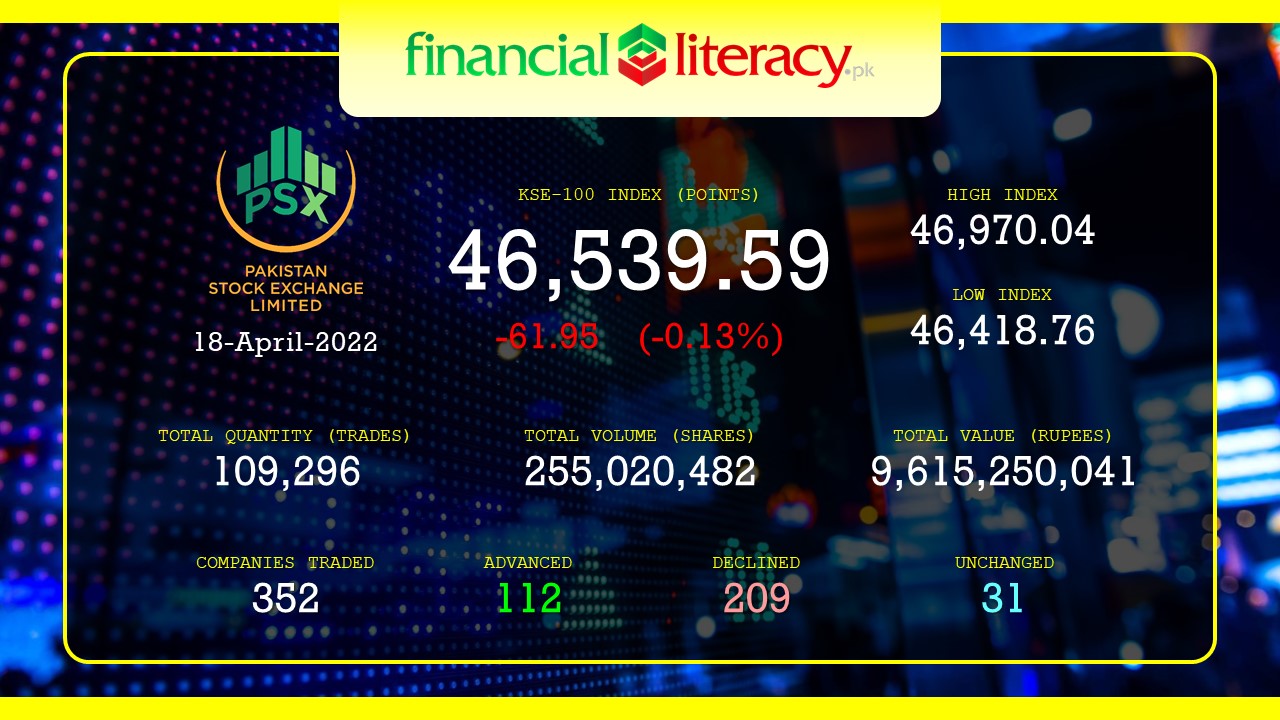
Current index 46,539.59 Change -61.95 Percent Change (-0.13%)

Current Index 44,803.31 Change -30.12 Percent Change (-0.07%)

Current Index 44,549.62 Change 133.42 Percent Change (0.30%)
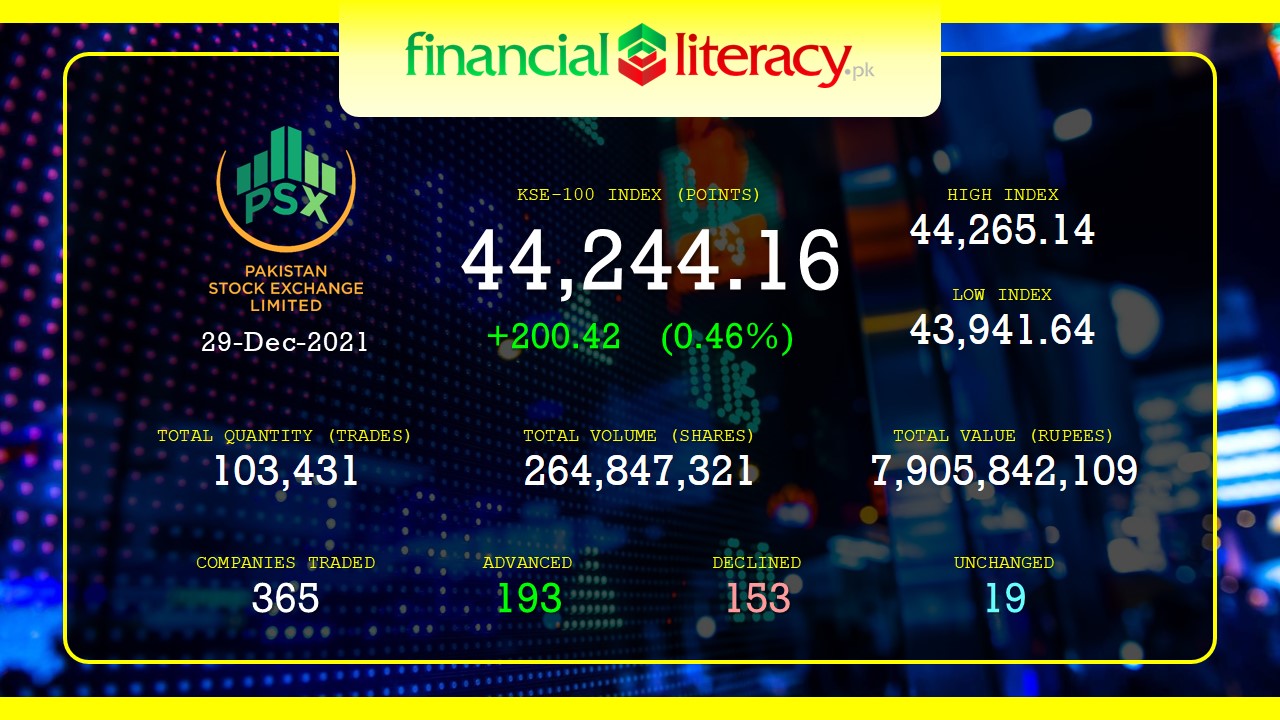
Current Index 44,244.16 Change 200.42 Percent Change (0.46%)
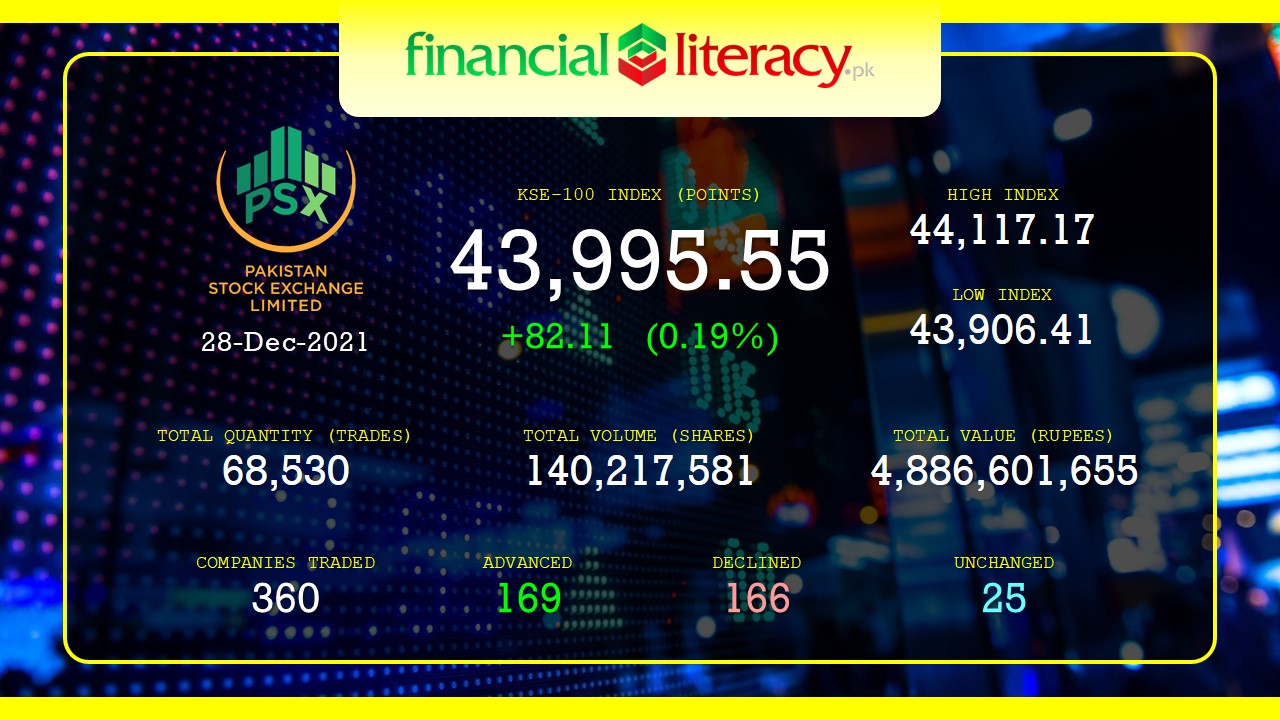
Current Index 43,995.55 Change 82.11 Percent Change (0.19%)
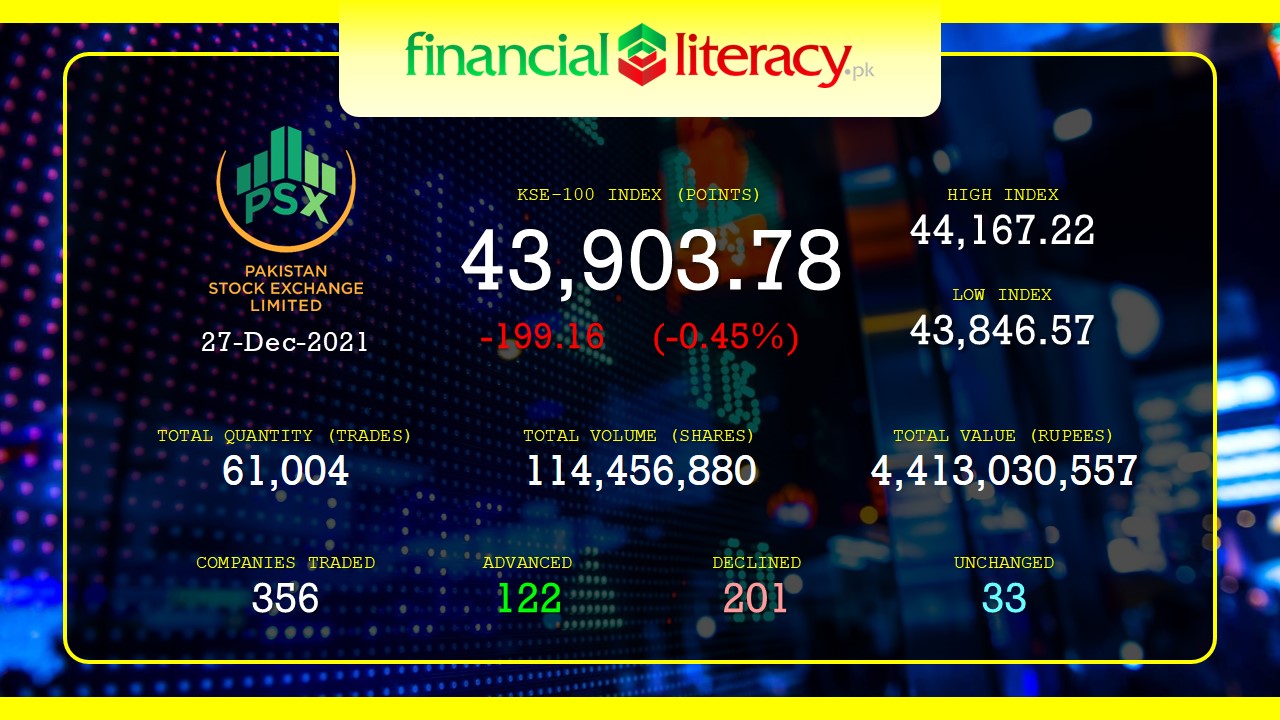
Current Index 43,918.43 Change -199.96 Percent Change (-0.45%)
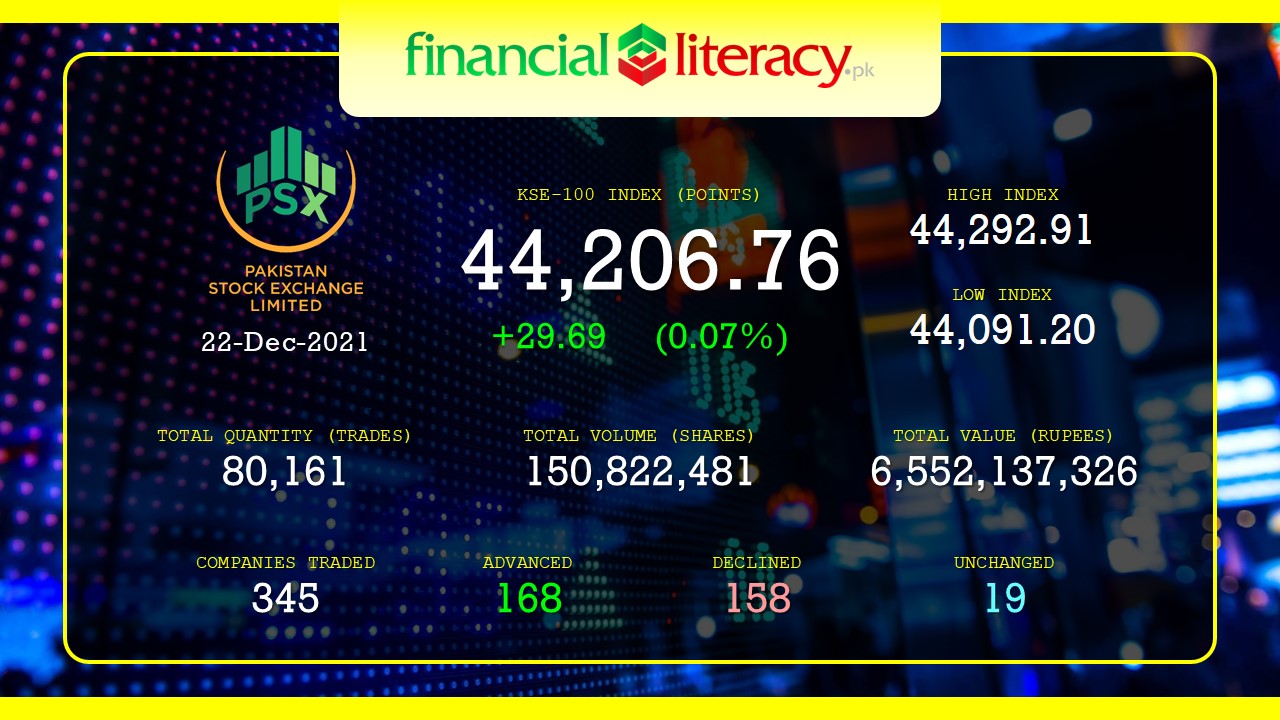
Current Index 44,206.76 Change 29.69 Percent Change (0.07%)