



For anyone stepping into the world of investing for the first time, keeping an eye on the weekly stock market report is like checking the weather report before planning a trip. It tells you whether the market is sunny and growing or stormy and falling.
The weekly performance report for the Pakistan Stock Exchange (PSX) covering October 26 to October 30, 2026, paints an encouraging picture for market watchers.
How the Market Performed
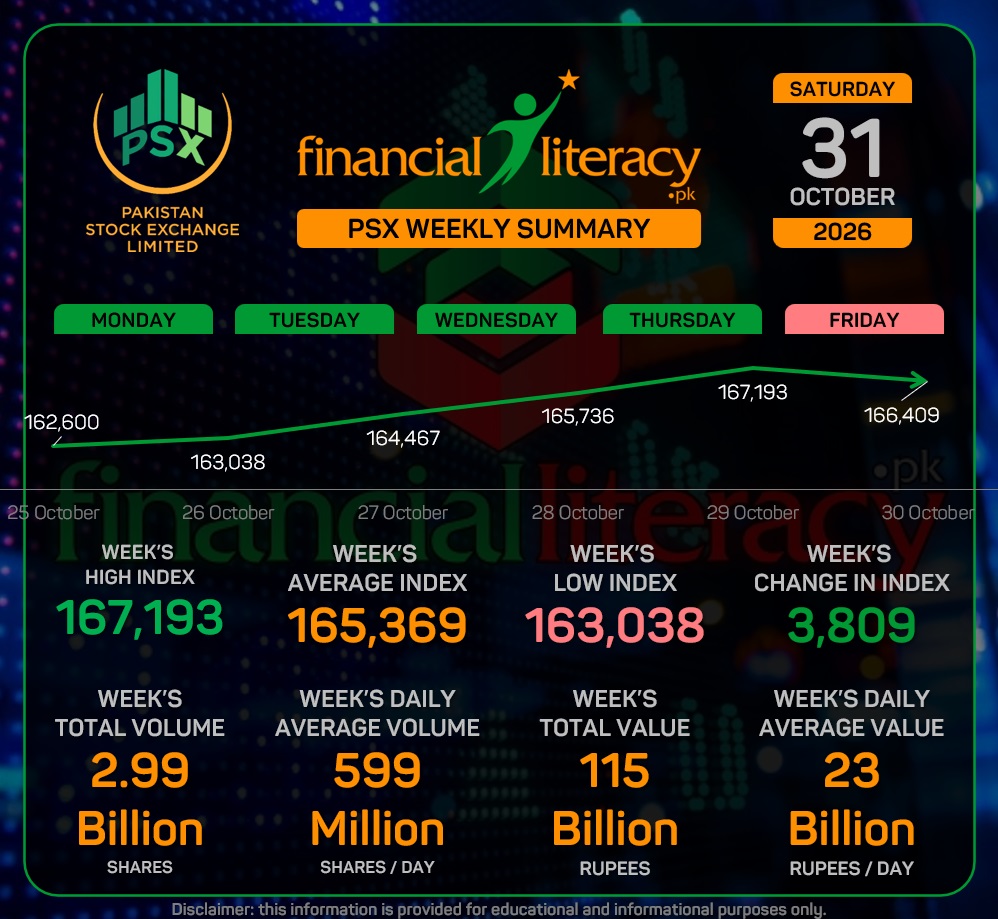
Throughout the week, the market displayed strong upward momentum. Starting at a low index point of 163,038 on Monday, October 26, the market steadily climbed, eventually touching a weekly high index of 167,193 by Thursday, October 29, before closing out Friday at 166,409.
Overall, the market recorded a net positive change of 3,809 points, with the average index hovering safely around 165,369.
High Trading Activity
For new investors, high trading volume is usually a sign of high interest and liquidity (meaning it is easier to buy and sell shares). Last week, the market saw heavy activity:
- Total Volume: Nearly 2.99 billion shares changed hands throughout the 5 trading days, averaging 599 million shares traded per day.
- Total Financial Value: Money moving through the exchange hit a massive Rs 115 billion total, averaging Rs 23 billion per day.
These numbers show that capital is actively flowing through the stock exchange, giving beginner investors plenty of opportunities to research strong companies and build their portfolios.
Glossary of Terms for New Investors
- Index (Market Index): A statistical measure that tracks the performance of a group of stocks. It acts like a thermometer to show whether the overall stock market is going up or down.
- Week’s High / Low Index: The highest and lowest points the market index reached during the trading week. It shows how much the market bounced around.
- Week’s Change in Index: The net difference in points from the beginning of the week to the end, showing overall market growth or decline.
- Volume (Shares): The total number of individual shares traded (bought and sold) by investors during a specific timeframe.
- Value (Rupees): The total monetary worth of all the shares traded during the week or day.
- Liquidity: How easily an investor can buy or sell an asset (like a stock) in the market without drastically affecting its price. High volume usually means high liquidity.